Amazon Q2 2026: advertising up 26%, seller services up 16%
Amazon’s second-quarter results show marketplace demand holding up, but the money sellers pay Amazon for advertising is rising faster than the volume it supports.
Key points
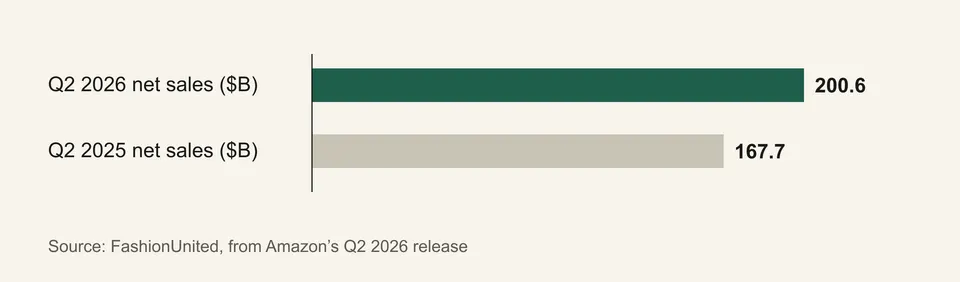
- Amazon reported second-quarter 2026 net sales of $200.6 billion, up 20% year on year2.
- Advertising revenue rose 26% to $19.8 billion, while third-party seller services revenue rose 16% to $46.8 billion1.
- Third-party sellers accounted for 61% of paid units, down from 62% a year earlier, even though total paid units rose 17%1.
- Amazon guided third-quarter net sales to $197 billion to $202 billion, or 9% to 12% growth2.
- The per-unit comparisons in this article are the publisher’s estimates, not Amazon disclosures1.
Amazon reported second-quarter 2026 results on 30 July 2026, with net sales of $200.6 billion, up 20% from $167.7 billion a year earlier2. For people who sell on the marketplace, the more telling lines sit below the headline. Advertising revenue grew 26% to $19.8 billion, while third-party seller services revenue grew 16% to $46.8 billion1. Our analysis is that advertising is the part of Amazon’s business where sellers’ costs are rising fastest, but the public figures are too coarse to show what any one seller pays.
What did Amazon report?
Beyond net sales, Amazon’s consolidated operating income was $27.5 billion, up from $19.2 billion2. North America sales were $116.2 billion, up 16%, and International sales were $42.2 billion, up 15%2. Online store revenue rose 15% to $70.4 billion1.
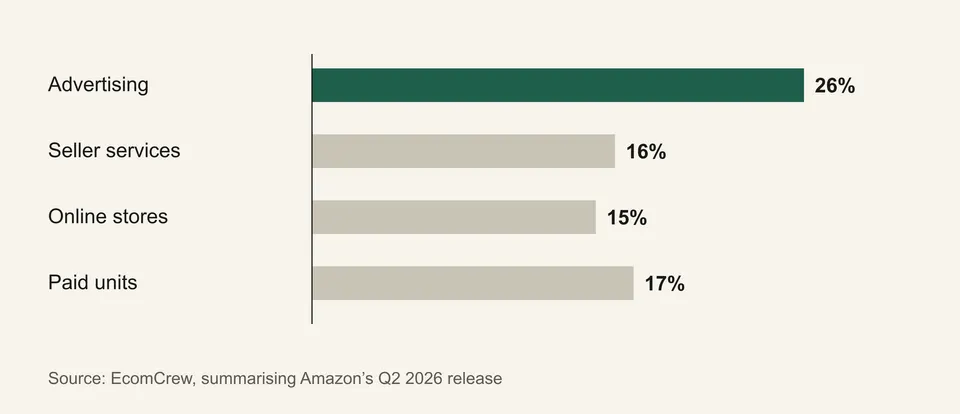
Worldwide paid units grew 17%1. Third-party sellers made up 61% of those units, down from 62% a year earlier1. That is a one-point move, and it is a share of units, not of sales value or seller profit.
How do the seller lines compare?
The EcomCrew analysis sets two numbers side by side. Third-party seller services, which cover the commissions, fulfilment and shipping fees sellers pay, grew 16%1. Advertising grew 26%1. EcomCrew estimates that third-party units grew about 15%, which would mean seller-services revenue per unit rose roughly 1%, while advertising revenue per paid unit rose about 8%1. Those are the publisher’s estimates, not figures Amazon disclosed1.
Our reading: if the estimates are close, the pattern is consistent with sellers spending more on advertising to win each sale, while the fee schedule itself moved little. It is also consistent with Amazon simply selling more ad inventory to brand advertisers and vendors, and the results do not separate these groups.
What changed in the guidance?
Amazon guided third-quarter net sales to $197 billion to $202 billion, or 9% to 12% growth2. The company pointed to an unfavourable currency effect of about 80 basis points and the timing of Prime Day2. The slower growth rate is therefore partly a calendar effect, since part of the Prime Day period fell in the second quarter.
What should sellers do with this?
The steps below are our recommendations, not Amazon’s.
- Measure advertising as a share of sales, by product. The aggregate ad figure says nothing about whether a given listing is profitable once its advertising cost of sale is included.
- Separate defensive from growth spend. Branded search often protects a sale you would partly have made anyway. Non-branded campaigns are where the cost per new customer shows up.
- Plan Q4 on current costs. Do not carry last year’s advertising cost into this year’s margin model. Rebuild it from the last 90 days of your own data.
- Do not read market share as your share. A one-point change in the third-party unit share is not a signal about demand for your category.
How would a rise in advertising cost show up in a margin?
The numbers in this example are invented to show the arithmetic. They are not Amazon’s or any seller’s.
Suppose a product sells for $30 and your advertising cost of sale is 12%, so advertising takes $3.60 per sale. If the same listing needs 20% to hold its position, that cost becomes $6.00, a difference of $2.40 per unit. On a product whose landed cost, marketplace fee and fulfilment fee leave $7 before advertising, the margin drops from $3.40 to $1.00. The sale volume has not changed, yet the product has gone from comfortable to marginal.
This is why aggregate growth rates matter less than your own ratio. A platform-wide ad number moving 10 points faster than seller-services revenue tells you the direction of travel. It does not tell you whether your advertising cost of sale has moved, and it does not tell you whether the extra spend bought extra sales.
A practical routine: export 90 days of advertising reports, group by product, and compare advertising cost of sale with the product’s break-even level. Products above break-even need a decision: raise the price, cut the spend, or drop the product. Do this before the fourth quarter, when competition for the same placements typically rises.
What is still unknown?
Neither source we retrieved gives Amazon’s own breakdown of how much of the advertising growth came from small sellers, large brands or vendors1,2. Neither gives average cost per click. Amazon’s full release was not available to us in this research, so the line-item figures above come from two secondary summaries that agree with each other where they overlap1,2. Check the figures against Amazon’s investor relations release before quoting them.
We will revisit this comparison when Amazon reports third-quarter results, which will show whether the gap between advertising growth and seller-services growth persists once Prime Day timing is no longer a factor.
Questions readers ask
How fast did Amazon’s advertising business grow in Q2 2026?
Advertising revenue grew 26% to $19.8 billion, against online store revenue growth of 15%1.
Did third-party sellers lose share of Amazon’s units?
Slightly. Third-party sellers made up 61% of worldwide paid units, down from 62% a year earlier, although total paid units grew 17%1.
Does this prove sellers are paying more per sale?
No. EcomCrew’s per-unit figures are its own estimates, and the public results do not break out what an average seller pays1. Check your own advertising cost of sale rather than relying on the aggregate.