Shopify’s Q2 2026 GMV reaches $115.6 billion, up 32%, as merchant solutions revenue grows 37%
Shopify reported 30%-plus growth in GMV, revenue, gross profit and free cash flow on 5 August 2026. The fastest-growing line is the one tied to payments and other services sold to merchants.

Key points
- Shopify reported second-quarter 2026 gross merchandise volume of $115.6 billion, up 32% from $87.8 billion a year earlier1.
- Revenue rose 34% to $3.58 billion, and gross profit rose 31% to $1.71 billion1.
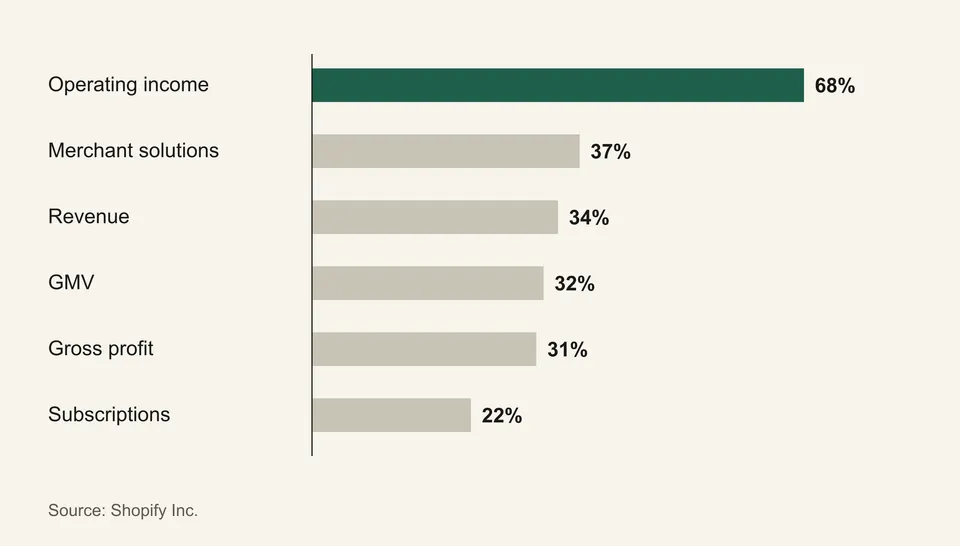
- Merchant solutions revenue, which Shopify reports separately from subscriptions, grew 37% to $2.78 billion, while subscription solutions grew 22% to $802 million1.
- Shopify guided third-quarter revenue growth to the low thirties percent and gross profit growth to the mid-to-high twenties percent1.
- GMV is the value of orders on Shopify stores overall; it is not a measure of any single merchant’s sales or profit1.
Shopify published its second-quarter 2026 results on 5 August 2026, reporting gross merchandise volume (GMV) of $115,567 million, up 32% from $87,837 million a year earlier, or 30% in constant currency1. Revenue was $3,583 million, up 34%, and gross profit was $1,708 million, up 31%1. The company's own headline claims growth of more than 30% across GMV, revenue, gross profit and free cash flow1. Our analysis is that the mix inside revenue matters more to merchants than the headline, because the fastest-growing line is the one that grows as merchants process more orders.
What did Shopify report for the quarter ended 30 June 2026?
The release sets Q2 2026 beside Q2 2025 as follows1.
| Measure | Q2 2026 | Q2 2025 | Change |
|---|---|---|---|
| GMV | $115,567M | $87,837M | +32% |
| Revenue | $3,583M | $2,680M | +34% |
| Gross profit | $1,708M | $1,302M | +31% |
| Operating income | $488M | $291M | +68% |
| Free cash flow | $654M | $422M | not stated |
Monthly recurring revenue (MRR) was $221 million, against $185 million a year earlier1. Free cash flow margin was 18%, up from 16%1. Net income was $1,502 million, but Shopify notes that excluding equity investments the figure was $439 million1. The company also reported $1,420 million of share repurchases in the quarter1.
Why does the revenue mix matter to merchants?
Shopify splits revenue in two. Subscription solutions, the monthly plan and app fees merchants pay, brought in $802 million, up 22%1. Merchant solutions, which the release reports as the larger line, brought in $2,781 million, up 37%1.
Our analysis: merchant solutions is the part of Shopify's income that rises with order volume, since it includes services merchants use as they sell. That is why it grew faster than subscriptions. For a merchant it is a reminder that the effective cost of a platform is not the monthly plan price alone. The cost of services layered on top, such as payment processing, scales with your sales.
The release does not break merchant solutions into payments, shipping, capital or other services in the figures we retrieved, so we cannot say which service drove the 37%1.
What did Shopify say about the next quarter?
For Q3 2026, Shopify guided revenue growth to the low thirties percent year on year and gross profit growth to the mid-to-high twenties percent1. It expects operating expenses of 33% to 34% of revenue and a free cash flow margin in the high teens to low twenties percent1. Shopify’s first-quarter release in May was headed "Merchants Clear $100 Billion in Q1 GMV", which gives the sequential comparison2.
What did management say?
Harley Finkelstein, Shopify's president, called it "a monster quarter: more than 30% growth in GMV AND revenue AND gross profit AND free cash flow"1. Jeff Hoffmeister, the chief financial officer, pointed to broad-based growth and operating leverage that flowed through to 18% free cash flow margins1.
What should merchants take from this?
The steps below are our recommendations, not Shopify's.
- Treat GMV as a platform statistic. It is the total value of orders across all Shopify stores. It does not tell you whether stores in your category are growing1.
- Audit your payment and app costs. If revenue tied to merchant services is growing faster than plan fees, check what share of your own sales goes to services rather than the plan itself.
- Compare year on year, not quarter on quarter. Q2 includes seasonal effects, so use the same quarter last year as your baseline.
- Use the guidance as a benchmark. Q3 guidance gives a figure to compare against when Shopify next reports1.
What is still unknown?
The release figures we retrieved do not give the number of active merchants, the split of GMV by region or category, or the size of Shopify's own payments business1. Those would tell a merchant more about competitive conditions than the platform-wide total. We also did not retrieve the earnings call, so management commentary beyond the release quotes is not covered here.
How can a merchant turn a platform statistic into a decision?
Platform totals are useful for context, but a store owner's decisions come from store-level numbers. A simple routine is to compare three of your own ratios against the same quarter a year ago: orders per thousand visitors, average order value, and the share of each order that goes to payment processing, apps and shipping software. The figures below are invented to show the arithmetic.
Suppose a store took $100,000 in orders last Q2 and $120,000 this Q2, a 20% rise. If its service and app costs rose from 6% to 8% of sales, those costs grew from $6,000 to $9,600, a 60% rise. The store grew more slowly than Shopify's 32%, and its costs grew faster than its sales. None of that would be visible in the platform's headline growth, which is why we suggest checking your own ratios rather than benchmarking against the aggregate.
Questions readers ask
What was Shopify’s GMV in Q2 2026?
Gross merchandise volume was $115,567 million, up 32% year on year, or 30% in constant currency1.
Which part of Shopify’s revenue grew fastest?
Merchant solutions grew 37% to $2,781 million, faster than subscription solutions at 22% to $802 million1.